Line Graph - note that curves and best fit lines can be drawn.
As each point is entered in the Table it is then plotted on the Graph. The students see the graph grow as the data is entered.
The axes autoscale so that all points are always visible.

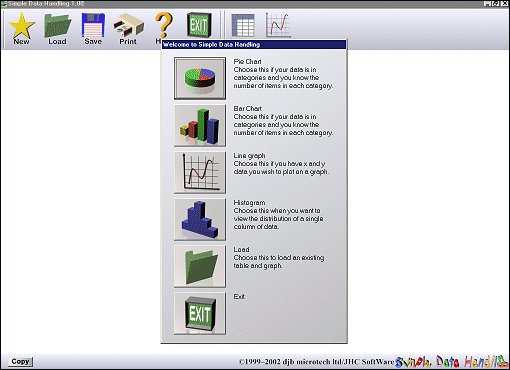 Simple icons and an uncluttered presentation
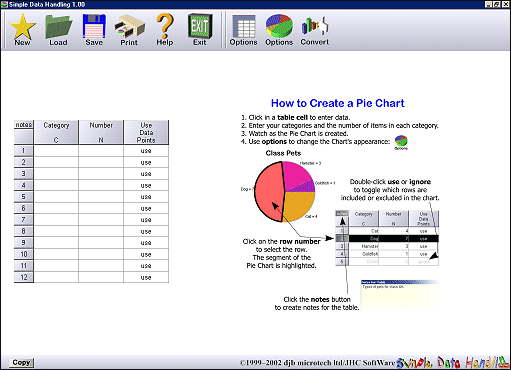 Getting started using a Pie chart
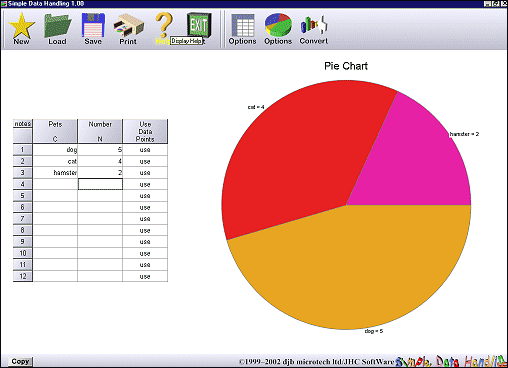 Data Entry
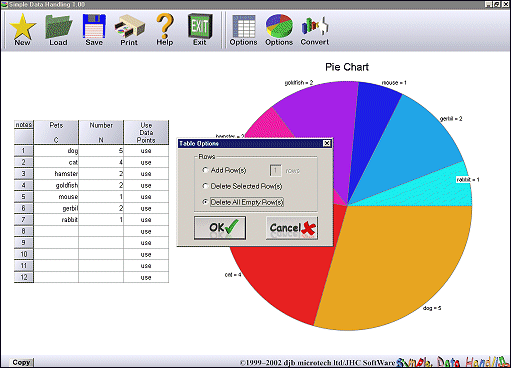 Pie chart grows as data is entered. Dialogue box shows Table options
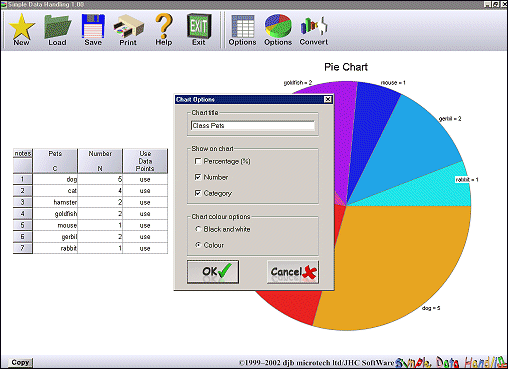 Dialogue box shows Chart options
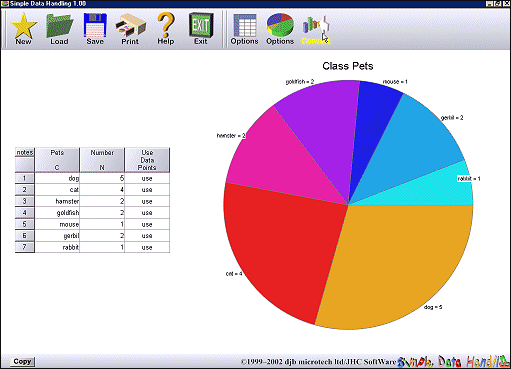 The completed chart. Selecting the Convert icon gives a Bar chart
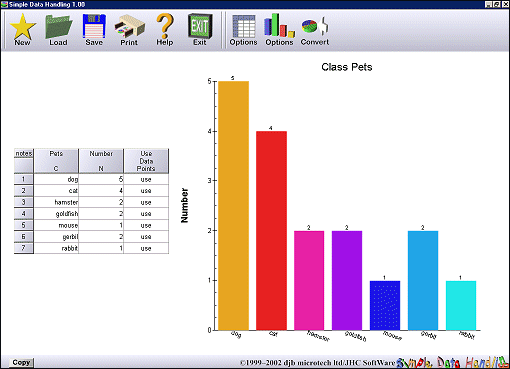 Bar chart representation of the same data
 Starting a line graph
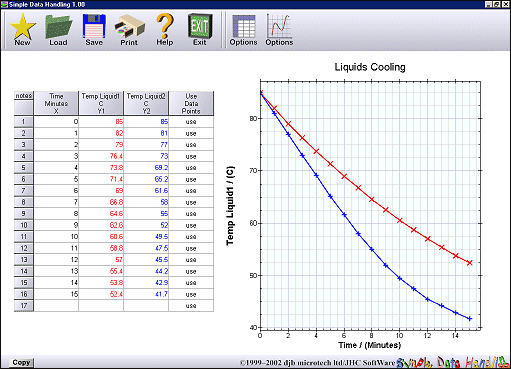 Line Graph - note that curves and best fit lines can be drawn.
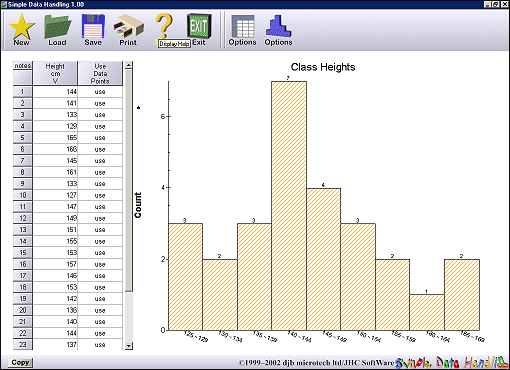 Histogram of class heights.
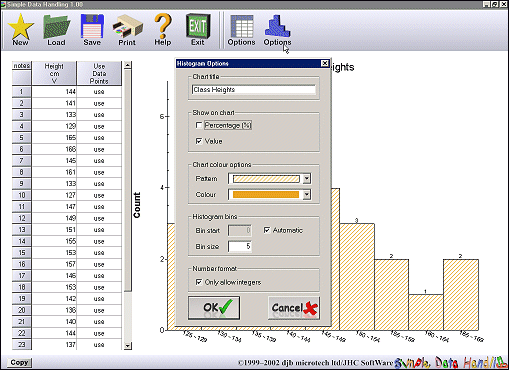 Chart options for a Histogram.
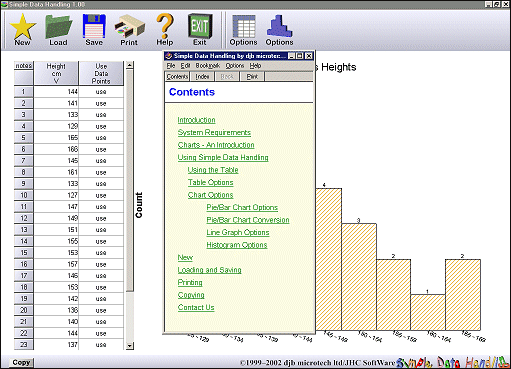 Help is always to hand